Automated Brown Adipose Tissue Segmentation in CT Images of Lymphoma Patients
Project by Kasper Jørgensen
Brown adipose tissue (BAT) plays a crucial role in energy expenditure and thermoregulation, making it a key focus in metabolic disease research. This project investigates the use of a nnU-Net model for automated BAT segmentation in CT images of lymphoma patients. By relying solely on anatomical CT data, the approach avoids potential biases linked to metabolic activity in PET-based analyses.
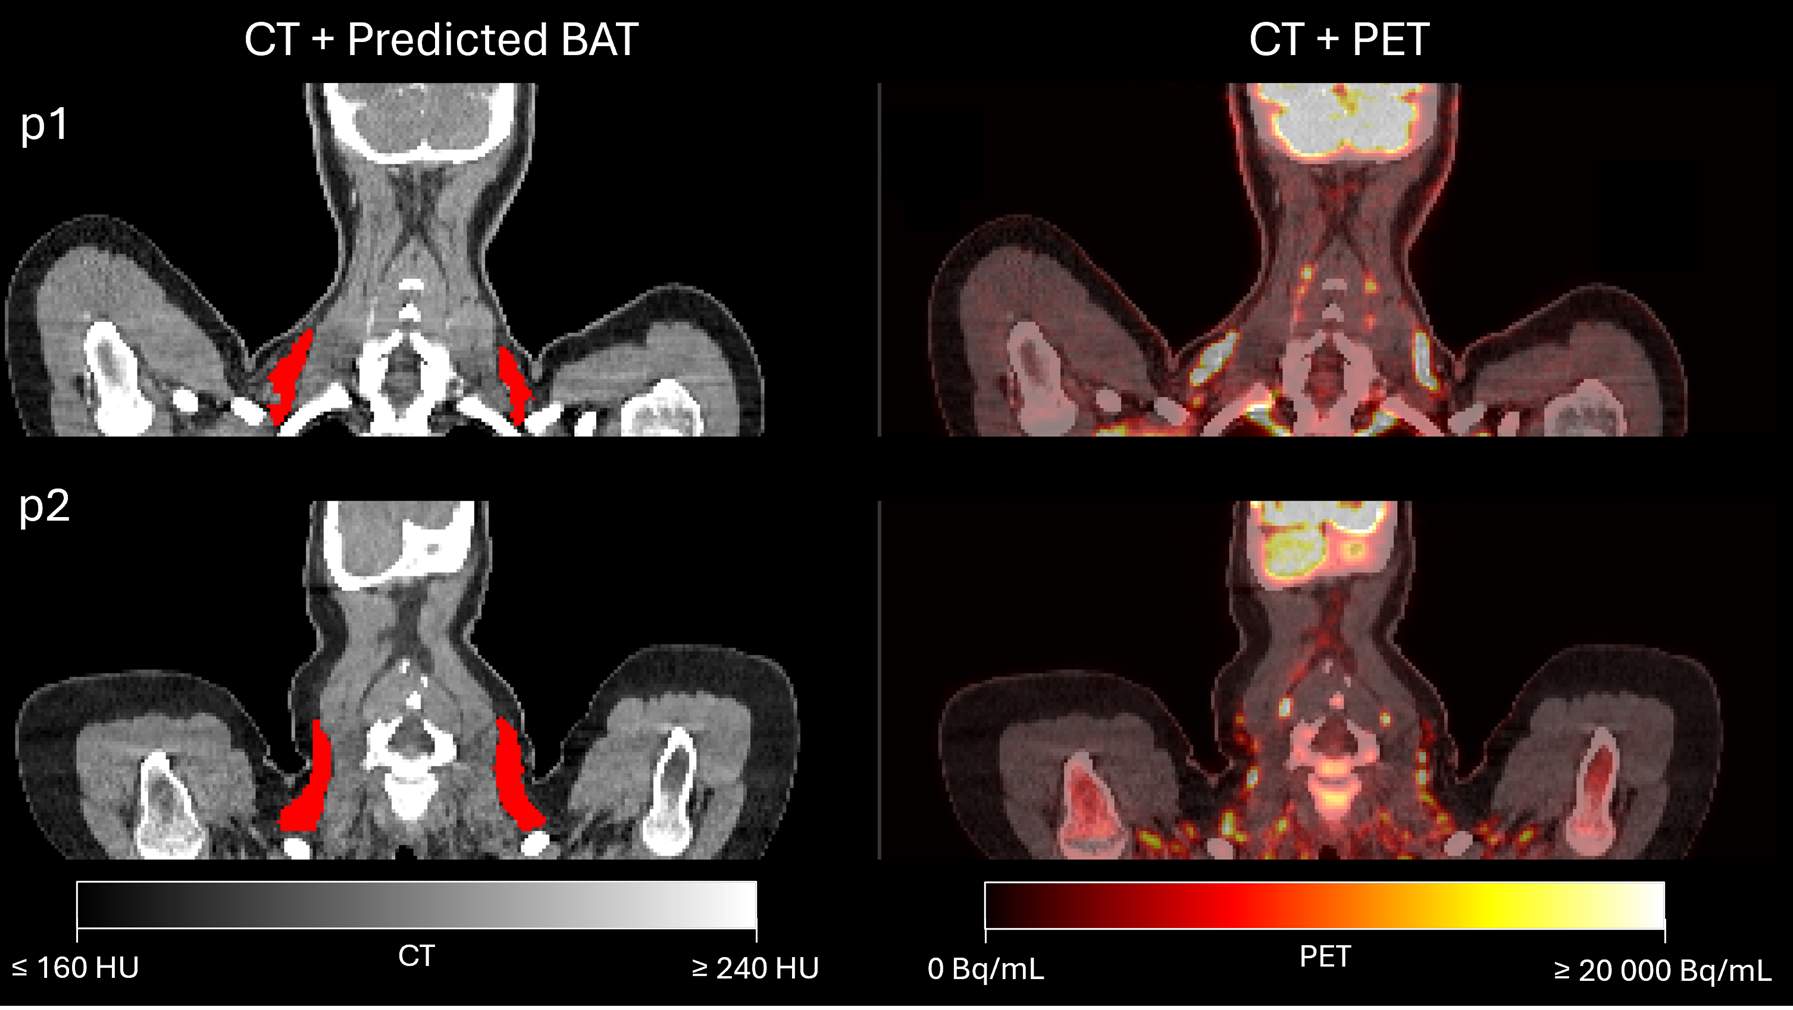
Project BackgroundBAT segmentation often combines imaging modalities such as PET/CT or PET/MRI. However, PET-based segmentation reflects metabolic activity, which may obscure the anatomical boundaries of BAT. To address this, the project focuses on segmenting BAT using only CT data, independent of metabolic signals.
Segmenting based solely on CT images is inherently challenging due to the minimal contrast between BAT and other adipose tissues. However, CT images still provide sufficient anatomical detail for physicians to identify BAT.
Manual segmentation is time-consuming and prone to variability, generating the need for automated solutions. Deep learning methods like the nnU-Net model offer a powerful alternative by directly mapping image data to segmentation masks, eliminating the need for handcrafted features. In this project, we employ a 3D nnU-Net model trained exclusively on CT data to segment BAT. Integration into the TotalSegmentator software allows effective BAT segmentation without PET data. The model has been trained and tested on 189 CT images from lymphoma patients.
Project PotentialThis automated BAT segmentation model represents a significant step forward in BAT analysis, enabling reliable automated segmentation directly from CT scans without the need for PET data. While the current test set is limited, further validation with larger and more diverse datasets could improve its robustness and broaden its clinical applicability. By making BAT analysis more efficient, this approach can contribute to advancing metabolic research and optimizing clinical workflows.
Challenges Addressed by Automated CT-Based Segmentation

Performance of the Automated BAT Segmentation Model
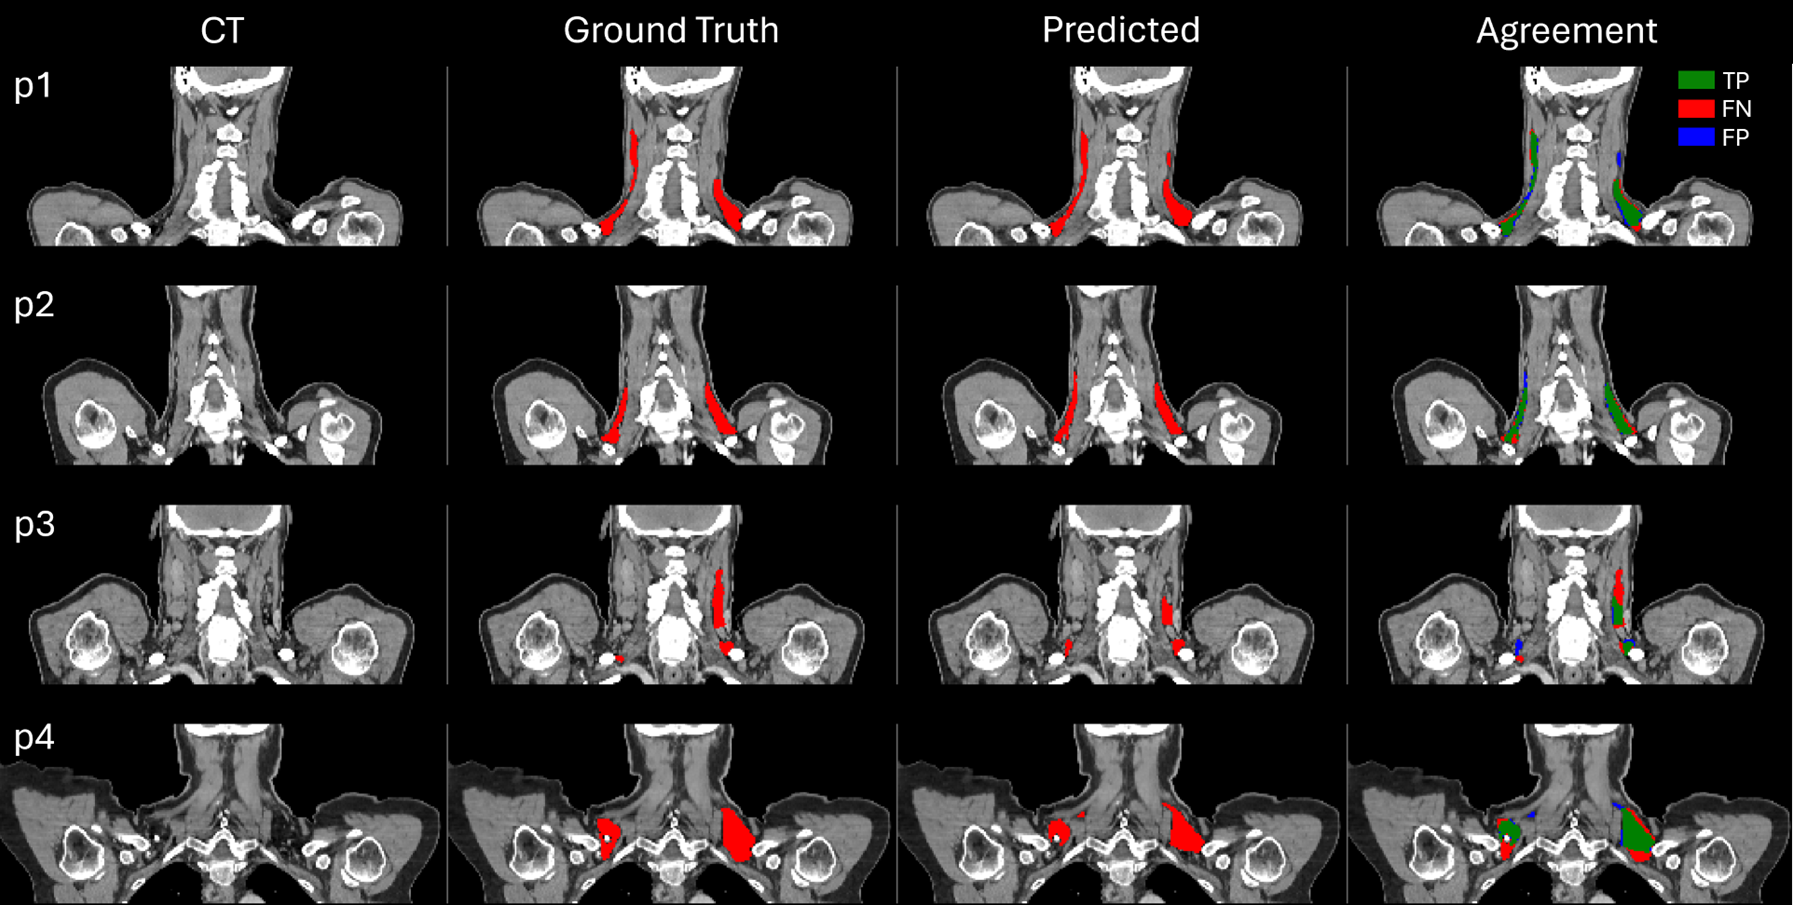
To evaluate the model's accuracy, an agreement analysis was performed. This analysis helps visually identify where the model's predictions align with or diverge from the ground truth annotations.

True Positive (Green): Correctly predicted BAT by the model.
False Negative (Red):BAT missed by the model that should have been identified.
False Positive (Blue): Areas incorrectly identified as BAT, where there is no BAT.
The model's performance is not perfect, and inconsistencies are observed in areas where the ground truth annotations are unclear or less precisely defined.Performance of the Model Against CT/PET
